::: {#notebook .border-box-sizing tabindex="-1"} ::: {#notebook-container .container} ::: {.cell .border-box-sizing .text_cell .rendered} ::: {.prompt .input_prompt} View this report with the Ipython Notebook Viewer (where it looks best). :::
::: {.inner_cell} ::: {.text_cell_render .border-box-sizing .rendered_html} The Listiness of Wikipedia¶ {#The-Listiness-of-Wikipedia}
::: ::: :::
::: {.cell .border-box-sizing .text_cell .rendered} ::: {.prompt .input_prompt} :::
::: {.inner_cell} ::: {.text_cell_render .border-box-sizing .rendered_html} Although it was only an aside, an answer of "What is a Reference work?" caught my attention at UC Berkeley iSchool's March 21st Friday Afternoon Seminar by Michael Buckland. One possible answer suggested was: works that are over 80% list.
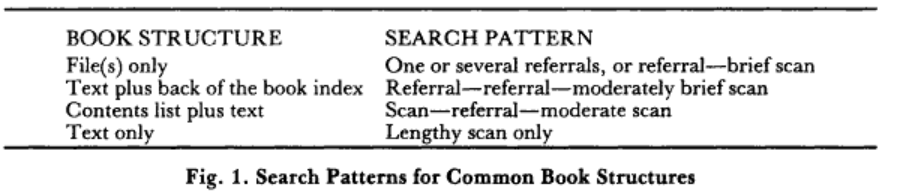 Bates' classification of References works search patterns.
That definition, although seeming a bit short, was actually serious suggestion published by Marcia Bates in 1984. [Bates, Marcia J. "What Is a Reference Book: A Theoretical and Empirical Analysis." RQ 26 (Fall 1986): 37-57] This is an elegant solution in my opinion as a way to define reference works because although heuristic, it's entirely quantitative. Still necessary though, is a definition of list. According to Bates every book is a certain percentage list. Consider a classical monograph, it probably has a table of contents, or index - which is a list structure.
At this point in reading, I realised that it would be simple identify what parts of Wikipedia articles are list. And so, we could determine the percentage list - or the "listiness" of - each Wikipedia article. ::: ::: :::
::: {.cell .border-box-sizing .text_cell .rendered} ::: {.prompt .input_prompt} :::
::: {.inner_cell} ::: {.text_cell_render .border-box-sizing .rendered_html}
::: ::: :::
::: {.cell .border-box-sizing .text_cell .rendered} ::: {.prompt .input_prompt} :::
::: {.inner_cell}
::: {.text_cell_render .border-box-sizing .rendered_html}
Analysing a May 2014 copy of English Wikipedia, we look at the listiness of all articles in the main namespace. To do this I used the xml_dump library from the excellent mediawiki-utilities by [@halfak]{.citation}.
In wikitext lists are identified, by the prepending of a line with the characters ____ (unordered list) and # (numbered list). Additionally there are Infoboxes, which use | (pipe character) and tables whose rows begin with |- (pipe dash). What percentage of lines begin with any of these characters therefore determine the share of list of an article, or the "listiness" as I am now coining it.
We do not allow redirect pages - pages with a starting '#' character and are one line long. Those pages which are not redirects, we term 'canonical pages'. We do not allow "talk" pages either.
So for instance, we can look at the statistics of each of these different line-starting characters. Below are the mean number of these line-startings per page. ::: ::: :::
::: {.cell .border-box-sizing .text_cell .rendered} ::: {.prompt .input_prompt} :::
::: {.inner_cell} ::: {.text_cell_render .border-box-sizing .rendered_html}
::: ::: :::
::: {.cell .border-box-sizing .code_cell .rendered} ::: {.input} ::: {.prompt .input_prompt} In [3]: :::
::: {.inner_cell} ::: {.input_area} ::: {.highlight} canon_description = canonical.describe() canon_description.loc[['mean','std']] ::: ::: ::: :::
::: {.output_wrapper} ::: {.output} ::: {.output_area} ::: {.prompt .output_prompt} Out[3]: :::
::: {.output_html .rendered_html .output_subarea .output_pyout} ::: {style="max-height: 1000px; max-width: 1500px; overflow: auto;"} _ # |- | total
mean 6.660130 0.457347 3.392566 29.755385 2284.055053 std 33.667805 7.173435 24.983288 124.254805 4120.072758
2 rows × 5 columns ::: ::: ::: ::: ::: :::
::: {.cell .border-box-sizing .text_cell .rendered} ::: {.prompt .input_prompt} :::
::: {.inner_cell} ::: {.text_cell_render .border-box-sizing .rendered_html} We read this as the mean average number of undorded list items per page is 6.6, the number of orderer list items per page is 0.45 etc. These number seem reasonable, and commensurate with casual browsing experience. However we also see that the average number of lines per article is 2284, which seems very high. But as you can see the standard deviation for total lines is very large too. That means there are some extremely long articles out there, especailly when considering an article I wrote at recently is only 24 lines long! Although, to be sure, all lines are not created equally.
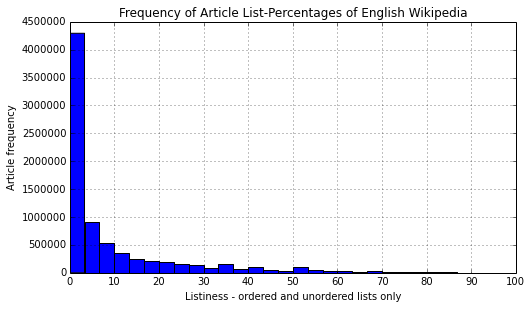
Now we are in a perfect place to start looking at listiness distributions. Let's visualise a histogram of the listinesses of all the pages. This first histogram just considers the classical ordered and unordered lists. ::: ::: :::
::: {.cell .border-box-sizing .code_cell .rendered} ::: {.input} ::: {.prompt .input_prompt} In [5]: :::
::: {.inner_cell} ::: {.input_area} ::: {.highlight} show_list_plot() ::: ::: ::: :::
::: {.output_wrapper}
 :::
:::
:::
:::
::: {.cell .border-box-sizing .text_cell .rendered} ::: {.inner_cell} ::: {.text_cell_render .border-box-sizing .rendered_html} Quite clearly we can see a power law distribution. Lets recall that 80% listiness is Bates' threshhold for considering a book a reference book. In our case lets see how many articles are at least 80% listy. ::: ::: :::
::: {.cell .border-box-sizing .code_cell .rendered} ::: {.input} ::: {.prompt .input_prompt} In [6]: :::
::: {.inner_cell} ::: {.input_area} ::: {.highlight} canonical[canonical['*and#per'] >= 0.8].shape[0] / float(canonical.shape[0]) ::: ::: ::: :::
::: {.output_wrapper} ::: {.output} ::: {.output_area} ::: {.prompt .output_prompt} Out[6]: :::
::: {.output_text .output_subarea .output_pyout} 0.0032001019048792404 ::: ::: ::: ::: :::
::: {.cell .border-box-sizing .text_cell .rendered} ::: {.prompt .input_prompt} :::
::: {.inner_cell} ::: {.text_cell_render .border-box-sizing .rendered_html} It's 0.32%, or about three-tenths of one percent of articles are 80% or more listy when considering ordered and unordered lists.
Now lets allow for charts and infoboxes in our analysis. To eliminate confusion, pages like List of Feminists is actually mainly a table! In our terminology it might be called "Table of Feminists", althought the "See Also" section at the end is a proper list.
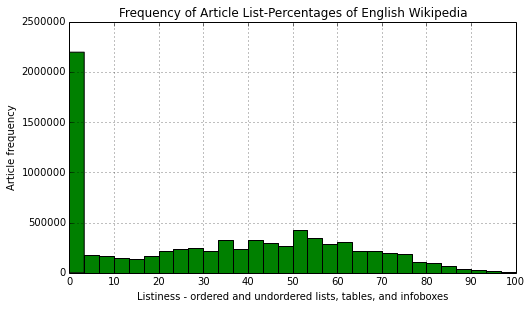
Now we allow table cells and infoboxes that exist to come into our listiness calculations. This produces a new picture. ::: ::: :::
::: {.cell .border-box-sizing .code_cell .rendered} ::: {.input} ::: {.prompt .input_prompt} In [8]: :::
::: {.inner_cell} ::: {.input_area} ::: {.highlight} show_list_and_table_plot() ::: ::: ::: :::
::: {.output_wrapper}
 :::
:::
:::
:::
::: {.cell .border-box-sizing .text_cell .rendered} ::: {.prompt .input_prompt} :::
::: {.inner_cell} ::: {.text_cell_render .border-box-sizing .rendered_html} Right away a noticeable change has occurred in the distribution. One can make out a Gaussian distribution centred at about 50% listiness. Also the scale has changed, with about half of those articles which were previously 0% listy, becoming listy. Just visually we see that percentage of lines that are contributed to by tables and infoboxes, are appreciable at a large level. In fact, if we find our percentage of articles that exceed the 80% listiness threshold under the table and infobox definition, now we have: ::: ::: :::
::: {.cell .border-box-sizing .code_cell .rendered} ::: {.input} ::: {.prompt .input_prompt} In [9]: :::
::: {.inner_cell} ::: {.input_area} ::: {.highlight} canonical[canonical['allper'] >= 0.8].shape[0] / float(canonical.shape[0]) ::: ::: ::: :::
::: {.output_wrapper} ::: {.output} ::: {.output_area} ::: {.prompt .output_prompt} Out[9]: :::
::: {.output_text .output_subarea .output_pyout} 0.03052258792303092 ::: ::: ::: ::: :::
::: {.cell .border-box-sizing .text_cell .rendered} ::: {.prompt .input_prompt} :::
::: {.inner_cell} ::: {.text_cell_render .border-box-sizing .rendered_html} ... about 3% of all articles. This represents an order of magnitude increase.
Now we have such a figure, so what? By itself I'm not sure if we can draw any conclusions about Wikipedia being very listy. It would be instructive to compare this to other encyclopedias or libraries. You could measure whatever of Google Books is OCR'd, if you had access to it. If anyone knows of any comparable statistics please get in touch. ::: ::: :::
::: {.cell .border-box-sizing .text_cell .rendered} ::: {.prompt .input_prompt} :::
::: {.inner_cell} ::: {.text_cell_render .border-box-sizing .rendered_html}
::: ::: :::
::: {.cell .border-box-sizing .text_cell .rendered} ::: {.prompt .input_prompt} :::
::: {.inner_cell} ::: {.text_cell_render .border-box-sizing .rendered_html} To understand more about listy Wikipedia articles there were a few more avenues of inquiry to take. A first stop was to investigate if the list and table types correlated with each other. ::: ::: :::
::: {.cell .border-box-sizing .code_cell .rendered} ::: {.input} ::: {.prompt .input_prompt} In [2]: :::
::: {.inner_cell} ::: {.input_area} ::: {.highlight} canonical.corr() ::: ::: ::: :::
::: {.output_wrapper} ::: {.output} ::: {.output_area} ::: {.prompt .output_prompt} Out[2]: :::
::: {.output_html .rendered_html .output_subarea .output_pyout} ::: {style="max-height: 1000px; max-width: 1500px; overflow: auto;"} _ # |- | total
_ 1.000000 0.016075 0.049516 0.045971 -0.093864 # 0.016075 1.000000 0.019311 0.023440 -0.031146 |- 0.049516 0.019311 1.000000 0.764544 -0.045862 | 0.045971 0.023440 0.764544 1.000000 -0.093092 total -0.093864 -0.031146 -0.045862 -0.093092 1.000000
5 rows × 5 columns ::: ::: ::: ::: ::: :::
::: {.cell .border-box-sizing .text_cell .rendered} ::: {.prompt .input_prompt} :::
::: {.inner_cell} ::: {.text_cell_render .border-box-sizing .rendered_html} None of these correlations are very strong, except for one. The correlation between the number of lines starting with |- and | is 0.76 over English Wikipedia. To those who know more about Wikitext, this would be obvious because table rows start with |-, and the delimiter for each column in that row begins with |. However what makes this difficult to disentangle, is that the number of columns may vary, so a 4-column table would have 4 times as many | as |-. And of course Templates, use | character to separate parameters and are not related to tables whatsoever.
With our correlation matrix being rather uninformative, I wanted to see which where the most highly occurring words in the titles of our listiest pages. The left column is the total number of times the word occurs in all page titles. The listiest column is the number of times that word occurs in the titles articles who are 80% listy by the "list and table" definition. Lastly the ratio column is a division of listiest/all. Compare displayed ratio to the ratio of 0.03 which is the composition of total listy articles versus all articles. The table is sorted by the listiest column. ::: ::: :::
::: {.cell .border-box-sizing .code_cell .rendered} ::: {.input} ::: {.prompt .input_prompt} In [74]: :::
::: {.inner_cell} ::: {.input_area} ::: {.highlight} lexemes_combined[lexemes_combined["listiest"] > 150].sort(columns="listiest", ascending=False).head(20) ::: ::: ::: :::
::: {.output_wrapper} ::: {.output} ::: {.output_area} ::: {.prompt .output_prompt} Out[74]: :::
::: {.output_html .rendered_html .output_subarea .output_pyout} ::: {style="max-height: 1000px; max-width: 1500px; overflow: auto;"} all listiest ratio (listiest/all)
of 640540 60163 0.093925 list 92978 34307 0.368980 in 488559 22937 0.046948 the 355866 17071 0.047970 – 31977 10836 0.338869 for 415190 9120 0.021966 mens 23931 5837 0.243910 singles 7986 5391 0.675056 wikipediaarticles 295972 5358 0.018103 season 41053 5323 0.129662 and 154046 5133 0.033321 championships 17045 5121 0.300440 at 47756 5066 0.106081 world 34675 4981 0.143648 district 51854 4780 0.092182 by 105340 4673 0.044361 team 36328 4256 0.117155 county 104867 4255 0.040575 football 53007 3853 0.072689 wikipediawikiproject 183711 3665 0.019950
20 rows × 3 columns ::: ::: ::: ::: ::: :::
::: {.cell .border-box-sizing .text_cell .rendered} ::: {.prompt .input_prompt} :::
::: {.inner_cell} ::: {.text_cell_render .border-box-sizing .rendered_html} As one might expect, the word "list" is the second most occurring word in titles of the listiest articles. These articles represent 36% of all the articles that have list in their title, which is significantly higher than what we'd expect on with no other information - 3%. Even "in" and "by" some occur slightly more than expected. This should make sense if you've ever browsed a Wikipedia article with a title something like "List of [x] by [y]" or "List of [x] in [z]".
The remainder of this Top 20 just goes to show how sport fans have chronicled results with great zeal. And the inexplicability of their zeal is an analogue to my curiosity for investigating this topic.
Contact me with more ideas of question on twitter [[@notconfusing]]{.citation}(https://twitter.com/notconfusing)‽‽‽
Find all the code for this analysis at https://github.com/notconfusing/listiness . ::: ::: :::
::: {.cell .border-box-sizing .text_cell .rendered} ::: {.prompt .input_prompt} :::
::: {.inner_cell} ::: {.text_cell_render .border-box-sizing .rendered_html} Start of Supporting Code¶ {#Start-of-Supporting-Code}
::: ::: :::
::: {.cell .border-box-sizing .code_cell .rendered} ::: {.input} ::: {.prompt .input_prompt} In [4]: :::
::: {.inner_cell} ::: {.input_area} ::: {.highlight} import pandas as pd import re import decimal import string
%pylab inline
linestarts = pd.read_table('linestarts.txt')
#somehow the txtfile has an extra column
del linestarts[u'Unnamed: 6']
#The redirect condition is that there is only one line and it began with a "#"
redir_cond = (linestarts['total'] == 1) & (linestarts['#'] == 1)
canon_cond = [not(x) for x in redir_cond]
redirs = linestarts[redir_cond]
canonical =  linestarts[(canon_cond)]
::: ::: ::: :::
::: {.output_wrapper} ::: {.output} ::: {.output_area} ::: {.prompt} :::
::: {.output_subarea .output_stream .output_stdout .output_text} Populating the interactive namespace from numpy and matplotlib ::: ::: ::: ::: :::
::: {.cell .border-box-sizing .code_cell .rendered} ::: {.input} ::: {.prompt .input_prompt} In [6]: :::
::: {.inner_cell} ::: {.input_area} ::: {.highlight} canonical['and#per'] = ( canonical[''] + canonical['#'] ) / canonical['total'] canonical['allper'] = ( canonical['*'] + canonical['#'] + canonical['|'] ) / canonical['total']
def show_list_plot():
    fig, axes = plt.subplots(figsize=(8,4.5))
    histplot = canonical['*and#per'].hist(ax=axes, bins=30, color='blue')
    NOPLACES = decimal.Decimal(10) ** 0
    plt.xticks(arange(0,1.1,0.1), [decimal.Decimal(x * 100).quantize(NOPLACES) for x in arange(0,1.1,0.1)])
    plt.xlabel('Listiness - ordered and unordered lists only')
    plt.ylabel('Article frequency')
    plt.title('Frequency of Article List-Percentages of English Wikipedia')

def show_list_and_table_plot():
    fig, axes = plt.subplots(figsize=(8,4.5))
    histplot = canonical['allper'].hist(ax=axes, bins=30, color='green')
    NOPLACES = decimal.Decimal(10) ** 0
    plt.xticks(arange(0,1.1,0.1), [decimal.Decimal(x * 100).quantize(NOPLACES) for x in arange(0,1.1,0.1)])
    plt.xlabel('Listiness - ordered and undordered lists, tables, and infoboxes')
    plt.ylabel('Article frequency')
    plt.title('Frequency of Article List-Percentages of English Wikipedia')
::: ::: ::: ::: :::
::: {.cell .border-box-sizing .code_cell .rendered} ::: {.input} ::: {.prompt .input_prompt} In [67]: :::
::: {.inner_cell} ::: {.input_area} ::: {.highlight} from collections import defaultdict lexeme_freq_all = defaultdict(int) lexeme_freq_list_only = defaultdict(int)
exclude = set(string.punctuation)
exclude.add(u'–')
def strip_punct(s):
    ls = s.lower()
    ls = ''.join(ch for ch in ls if ch not in exclude)
    return ls

for title in canonical['page+title']:
    title=str(title)
    for lexeme in title.split():
        cleaned = strip_punct(lexeme)
        #print lexeme, cleaned
        lexeme_freq_all[cleaned] += 1
for title in canonical[canonical['allper'] >= 0.8]['page+title']:
    title=str(title)
    for lexeme in title.split():
        cleaned = strip_punct(lexeme)
        lexeme_freq_list_only[cleaned] += 1

lexemes_all = pd.DataFrame.from_dict(data=lexeme_freq_all, orient='index')
lexemes_list_only = pd.DataFrame.from_dict(data=lexeme_freq_list_only, orient='index')
lexemes_combined = lexemes_all.join(lexemes_list_only, how='inner', lsuffix='_all', rsuffix='_listiest')
lexemes_combined.columns = [u'all', u'listiest']
lexemes_combined['ratio (listiest/all)'] = lexemes_combined['listiest'] / lexemes_combined['all']
::: ::: ::: ::: :::
::: {.cell .border-box-sizing .code_cell .rendered} ::: {.input} ::: {.prompt .input_prompt} In [70]: :::
::: {.inner_cell} ::: {.input_area} ::: {.highlight} lexemes_combined[lexemes_combined["listiest"] > 150].sort(columns="ratio (listiest/all)", ascending=False).head(16) ::: ::: ::: :::
::: {.output_wrapper} ::: {.output} ::: {.output_area} ::: {.prompt .output_prompt} Out[70]: :::
::: {.output_html .rendered_html .output_subarea .output_pyout} ::: {style="max-height: 1000px; max-width: 1500px; overflow: auto;"} all listiest ratio (listiest/all)
pri 728 664 0.912088 vrh 235 210 0.893617 divisional 410 325 0.792683 vas 365 279 0.764384 gornji 229 167 0.729258 filmography 526 371 0.705323 secretariat 463 325 0.701944 numberone 2394 1675 0.699666 singles 7986 5391 0.675056 stakes 1149 727 0.632724 handicap 342 213 0.622807 billboard 740 454 0.613514 fia 369 207 0.560976 iaaf 718 354 0.493036 grade 895 421 0.470391 listings 2959 1376 0.465022
16 rows × 3 columns ::: ::: ::: ::: ::: :::
::: {.cell .border-box-sizing .text_cell .rendered} ::: {.prompt .input_prompt} :::
::: {.inner_cell} ::: {.text_cell_render .border-box-sizing .rendered_html} Research questions: